


Solving simultaneous equations graphically: a step-by-step guide
Compared with algebraic solutions, having a visual representation of equations can offer a clear illustration to students and help them find the answer quickly.
Resource Keypoints
- What the graphical method is and why it is effective for solving simultaneous equations
- Key steps for solving equations using the graphical method
- Solving with the fx‑CG50 – Linear Equations
- Solving with the fx‑CG50 – Linear & Quadratic Equation

Understanding the Graphical Method
Many students will find the graphical method of solving linear and quadratic equations more intuitive. Being able to visualize on a graph precisely where the intersections of lines and curves are helps ensure students have confidence in the answer and can minimize the risks of errors that may occur when trying to answer the questions algebraically.
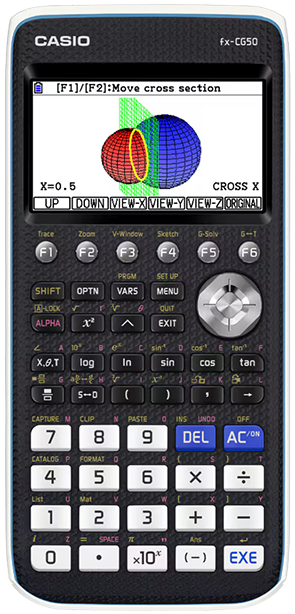
While solving these equations can be done with pen and paper in exams where calculators are not permitted, students who have access to powerful graphic calculators such as the Casio FX-CG50 will often find this a much faster and more accurate way of reaching the correct answer, especially when presented with more complex equations at A-level.

Key Steps for Graphical Solving
Whether simultaneous equations are being solved by hand or with a calculator, there are a few common steps that your students will need to follow in order to reach the right answer. These are:
- Identify the type of equations (eg, are they linear or quadratic)
- Draw each function on the same set of axes
- Find where the lines intersect and determine their coordinates
- Clearly state the values of the variables where the lines intersect

Using the FX-CG50 – Linear Equations
Examples of how to solve simultaneous equations graphically using a calculator
One of the easiest ways to solve equations graphically is with the help of a calculator that can draw the lines for your students. In order to solve both linear and quadratic equations using the Casio FX-CG50, students should follow a few key steps. Here is how to do both.
For solving linear equations graphically, the following steps are required:
- Press the Menu button and select Graph
- Enter the first function into the Y1 function, then press EXE
- Enter the second function into the Y2 function, then press EXE
- To draw the graph, choose Draw (F6)
- To find the point of intersection, press G-Solv (Shft+F5)
- Press INTSECT (F5)
- The calculator will display the coordinates of x and y in a decimal format

Using the FX-CG50 – Linear & Quadratic
To solve one linear and one quadratic equation, the following steps are required:
- Press the Menu button and select Graph
- Enter the linear function into the Y1 function. This may require the student to rearrange the equation into the correct format. Then press EXE
- Enter the quadratic function into the Y2 function, then press EXE
- To plot the functions, choose Draw (F6)
- In this type of question, there may be two points of intersection where the curve of the quadratic function meets the line of the linear one. To find these, press G-Solv (Shft+F5)
- To find the points of the intersection, press G-Solv (Shft+F5)
- Press INTSECT (F5)
- Press EXE to pin the leftmost point to the graph. The calculator will display the coordinates of x and y in a decimal format
- To show the second intersection, use the right arrow key to scroll. The first point will remain pinned. You can press EXE to pin the second point again

Common Mistakes
Common mistakes students may make
The most common issue students may encounter when solving equations graphically is either incorrectly plotting the graph or, when using a calculator, failing to rearrange equations as necessary before entering them as functions.
It’s also important for students to remember that linear and non-linear functions can intersect at 0, 1 or 2 points. If there are multiple points of intersection, make sure to match the correct value of x and y.
Frequently Asked Questions
More Resources

Solving simultaneous equations graphically: a step-by-step guide
Compared with algebraic solutions, having a visual representation of equations can offer a clear illustration to students and help them find the answer quickly.

Using Numerical Methods on the FX-CG50
Numerical methods help students solve equations that have no obvious algebraic solution. They’re one of the most challenging topics in GCSE, A-level and IB Mathematics. The FX-CG50 graphing calculator makes them much easier to teach and learn.
Exploring every app on the fx-CG50 graphic calculator
The FX-CG50 is our most advanced graphic calculator approved by exam boards and offers a broad range of features and functionality. So broad, in fact, that you might not even be aware of some of its capabilities.